|
Measurements have been made to determine the variation of impedance with frequency of four types of tube over the range 20 Hz to 10 kHz. The tube impedance has been shown to consist of resistive and reactive components, the reactance being inductive. The impedance and resistance of a given tube increase considerably with frequency. The inductance-frequency curve of a tube shows a pronounced maximum in the region of 100 Hz.
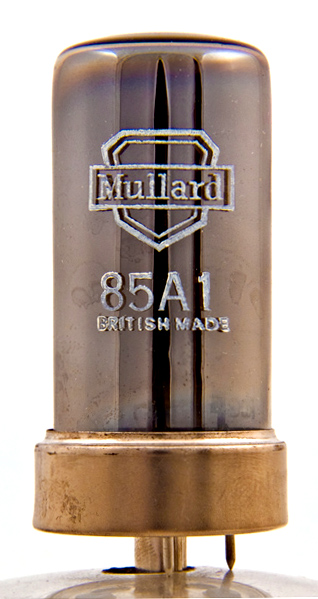 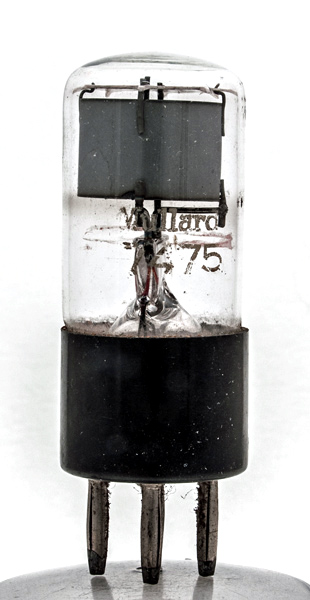
It has been pointed out by several investigators1, 2, 3 that the AC impedance of a glow-discharge voltage-regulator tube at high frequencies is considerably greater than the value which is quoted in data sheets for low frequencies. Andrew1 has drawn attention to this fact and mentions a few interesting experiments on 7475 and 85A1 tubes over the frequency range 50 to 20 kHz. He states that it would be useful to have information about the nature of the impedance, which he thinks may well be complex. A graph has been given by Benson2 showing that the impedance of Stabilovolts increases with frequency, but the upper frequency limit of the graph is only 6 kHz. Hunt3 has published an interesting article on some of the limitations of voltage stabilizers. He explains that although a glow-discharge tube is usually assumed to be equivalent to a constant voltage in series with a resistor, in actual fact, due to ion-inertia effects in the gas, there is a quadrature component in the valve current when an alternating voltage is applied. The equivalent circuit then approximately consists of a constant-voltage device in series with a resistor and inductor. Some typical resistance- frequency and inductance-frequency characteristics of a particular type of tube have also been given and briefly commented on by Hunt.
The authors have investigated in detail the variations of impedance with frequency of a number of glow-discharge tubes of both the high-stability and normal types. The nature of the impedance has also been determined in each case. Both new tubes and tubes which are undergoing life tests have been examined. The purpose of this article is to present the results of the work.
Measurements
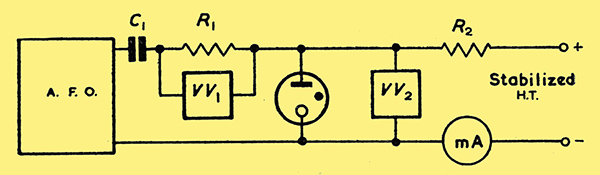
Fig. 1. Circuit used for impedance measurements.
The impedance of each tube was first measured over the frequency range 20 Hz to 10kHz. The circuit used is shown in Fig. 1 and is fundamentally similar to that employed by Andrew1 for his investigations. An audio-frequency oscillator (AFO) supplies a voltage across a non-inductive resistor R1 and the glow-discharge tube under test. R1, which has a value of 4 kΩ, provides a load for the oscillator and also a means of measuring the AC through the tube by reading the voltage developed across it (V1) with a valve-voltmeter VV1. It was decided to make the dropping resistor R2 of large value (65 kΩ) and to use a fairly high DC supply voltage so that the shunting effect of R2 across the tube could be neglected.
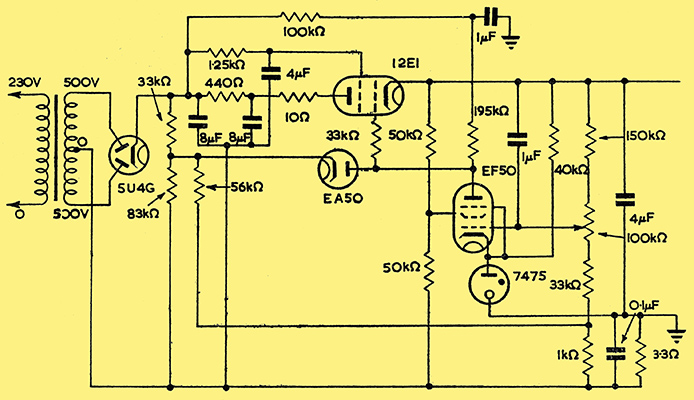
Fig. 2. 300 Volt stabilized supply.
An electronically-stabilized power supply was used to provide the DC voltage. The DC through the tube could be maintained constant at any particular value by means of an output-voltage control on the power-supply unit. The stabilized power supply has some interesting features and the circuit of it has, therefore, been included because it may be found useful for other applications. It is shown in Fig. 2. The design follows fairly closely the conventional arrangements with additional correcting devices except that the anode load resistor of the amplifier valve has not been taken to the stabilized supply for reasons given previously by one of the authors4. The supply could be improved by making some slight modifications so as to use a high-stability reference glow-discharge tube instead of the 7475 type.
The AC voltage (V2) across the tube under test was measured with a valve. millivoltmeter VV2. (Fig. 1.). A number of 85A1 tubes were first examined. Preliminary tests with a DC of 5 mA and an audio frequency of 50 Hz showed that by increasing the output voltage from the audio oscillator a voltage of up to 1 Volt could be maintained across the tube. Increasing the oscillator output voltage further resulted in instability and a high voltage across the tube. This was caused by the tube extinguishing on negative-voltage peaks.
Readings of VV1 and VV2 (i.e. V1 and V2) were taken over the stated frequency range with a constant voltage of 0.5 V across the tube, this being chosen because it gave a reasonable swing about the DC operating point without deionization on negative half cycles.
The impedance Ζ of each tube could easily be calculated from the readings as follows:
The AC through the tube is I = V1/R1.
Hence Ζ = V2/I = V2.R1/V1.
∴ Ζ = 2000/V1
Several 85A2 and 7475 tubes were then examined with the direct current through each tube at 5 mA and finally some S130 tubes were tested at a direct current of 50 mA.
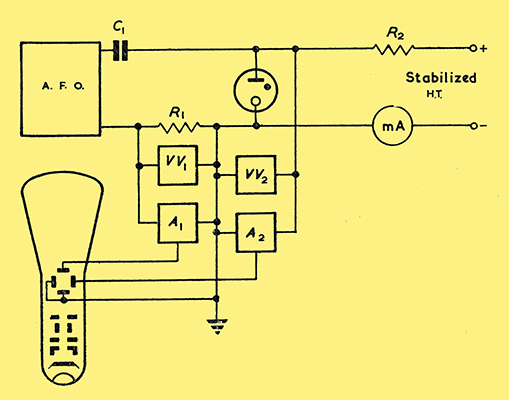
Fig. 3. Circuit used for phase-angle measurements.
Having obtained figures for the variation of impedance of several types of tube it was desired to find the resistive and reactive components of the impedances. A suitable way of doing this is to measure the phase-angle existing between voltages V1 and V2. This could be done by connecting the two voltages to a cathode-ray oscillograph, the resulting ellipse traced out on the screen giving a measure of the phase-angle5,6 The oscillograph was first connected to the circuit of Fig. 1, but after some initial tests it was found more convenient to connect R1 in the cathode lead of the glow-discharge tube so that the 'common' connection of the oscillograph could be earthed. Fig. 3 shows the circuit used. Trouble was first experienced due to relative phase shifts in the two amplifiers of the oscillograph. This was overcome by using similar amplifiers from two identical oscillographs and then using the X and Y plates of one of the oscillographs. Zero phase shift was then obtained. at all frequencies.
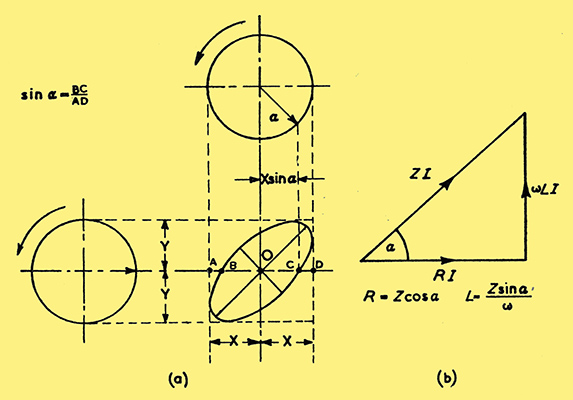
Fig. 4. Determination of phase-angle α, then the values of R and L.
Since ellipses were traced out on the screen of the oscillograph the tubes were known to have a reactive component. At high frequencies the tubes were very reactive. The phase-angle α. between V1 and V2, in each case, was calculated from the expression given on Fig. 4(a). Knowing α the reactance and resistance of each tube could be found from the impedance measurements as shown in Fig. 4(b).
The phase-angle measurements do not give an indication as to the nature of the reactance. In order to establish that the reactance was inductive and not capacitive, the effect of placing a capacitor in parallel with a tube was noted. Using a small capacitor (of capacitance 0.05 μF) across the tube the original ellipse could be brought to a straight line at some frequency. This shows that the reactance of the capacitor must be of opposite sign to that of the regulator tube, i. the latter is inductive.
Results
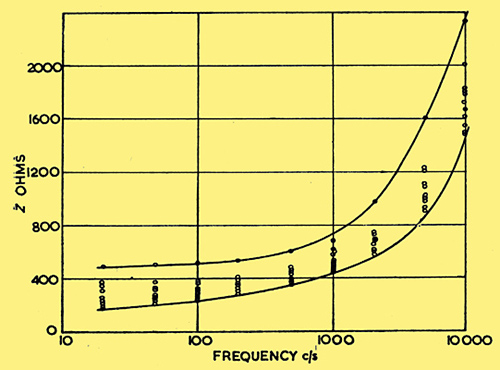
Fig. 5. 85A1, impedance of ten tubes.
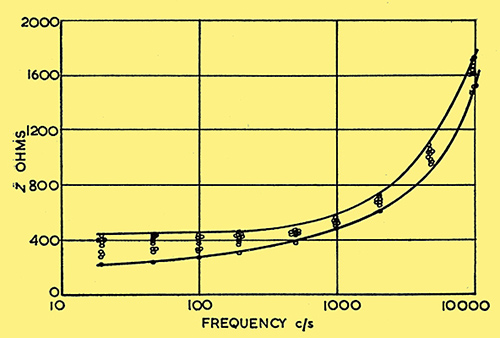
Fig. 6. 85A2, impedance of ten tubes.
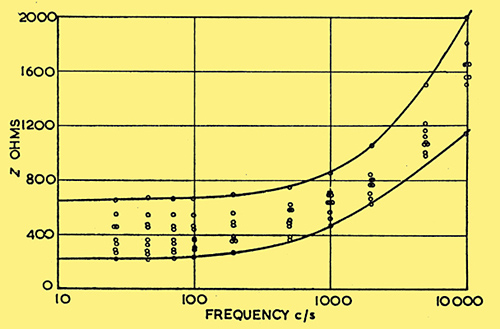
Fig. 7. 7475, impedance of ten tubes.
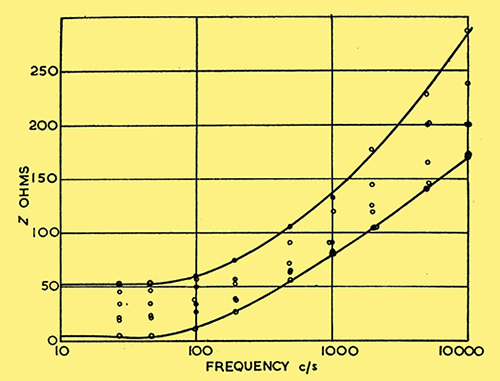
Fig. 8. S130, impedance of six tubes.
Impedance-frequency curves for several tubes of the four types examined are shown in Figs. 5, 6, 7 and 8. Because of the large number of readings taken, only the limiting curves have been drawn for each type to avoid confusion. These curves show quite clearly the variations in the characteristics from tube to tube of the same type.
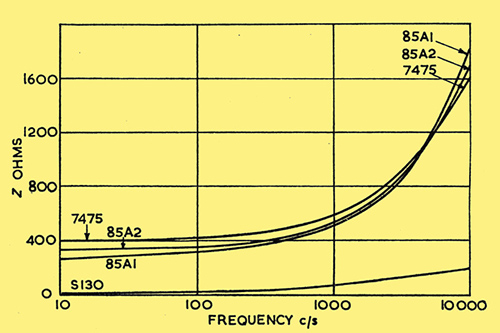
Fig. 9. 85A1, 85A2. 7475 and S130 impedance curves mean values.
The mean impedance-frequency curves have been plotted on Fig. 9 for easy comparison of the four types of tube. Typical inductance-frequency and resistance-frequency curves for the four types of tube are plotted on Figs. 10, 11, 12 and 13.
Oscillograms were taken of some of the ellipses and other phenomena observed on the cathode-ray oscillograph and these are shown in Figs. 14-19.
Discussion of Results
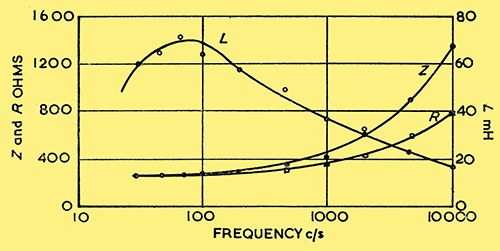
Fig, 10. 85A1, impedance, resistance and inductance.
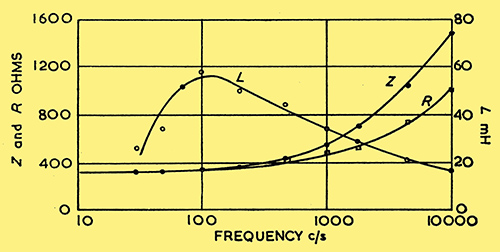
Fig. 11. 85A2, impedance, resistance and inductance.
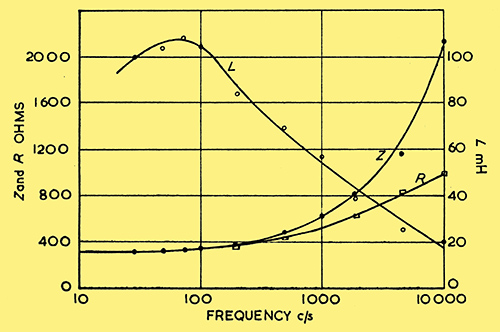
Fig. 12. 7475, impedance, resistance and inductance.
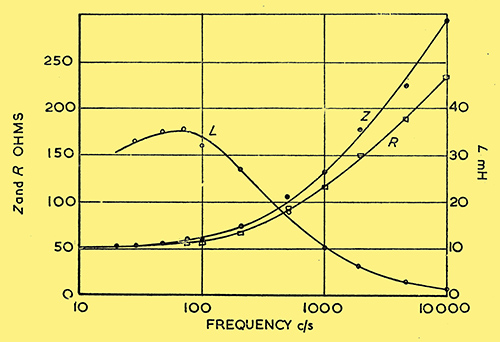
Fig. 13. S130, impedance, resistance and inductance.
It is seen from Figs. 5-9 that the impedance of a glow-discharge tube increases with frequency. The increase of impedance is almost linear with frequency (the graphs are plotted with a log-frequency base). There are considerable variations in the impedance curves from tube to tube even of the same design. Such variations might have been anticipated from previous work on other tube characteristics7. The 85A1 and 85A2 tubes have fairly similar characteristics as would be expected in view of the similar manufacturing techniques which they employ. The variations from tube to tube are less for the 85A2 type than the 85A1. Results obtained for several 85A1 tubes which had been operating continuously for over 30,000 hours at a constant current of 5 mA and for a number of 85A2 tubes which had been operating continuously for over 20,000 hours at the same current show that life does not noticeably affect the impedance-frequency curves. Work has not been carried out on the 7475 and S130 tubes after life test. It seems safe to assume however, from previous work on these tubes7 that their impedance-frequency curves will vary very greatly with life. This is so because the normal running-voltage/current curves of these tubes have been found7 to change rapidly both in magnitude and shape during continuous operation.
Out of twenty S130 tubes tested, few were capable of giving reliable results. Most tubes exhibited severe negative-resistance portions bin their characteristics. In view of this only six tubes which gave fair performance were examined. With this type it was found impossible to develop more than about 0.1 V across some tubes at low frequencies due to their very low impedance. It can be seen from Fig. 8 that the impedances in some cases are only a few Ohms, although one tube has a value of about 50 Ohms at low frequencies.
Figs. 10,11, 12 and 13 show that the inductance-frequency and resistance-frequency curves for the four types of tube are of the same general forms. The value of the inductance of all tubes seems to be of the same order and all the inductance-frequency curves have a maximum value in the region of 100 Hz. The inductance may be attributed to the effects of ion inertia. The fact that the inductance is a maximum at a particular frequency seems to indicate that a mechanical resonance of the ions occurs at this frequency. The points on the inductance-frequency curves at the lower frequencies are slightly scattered, the reason being that where the phase-angle is small the errors become larger due to the dimensions of the ellipse5.
The tube resistance increases with frequency, the increase being again almost linear with frequency, and at a given frequency the S130 tubes have much smaller resistances than the other types tested.
It has already been stated that on placing a small capacitor in parallel with the stabilizer tube the phase-angle ellipse could be brought to a straight line at some frequency. The condition for a parallel LC circuit to act as a pure resistance is that the frequency f should equal
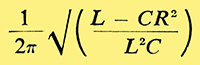
A check was, therefore, possible on the measurements. Values of L and R obtained by experiment, together with the value of C used, were substituted in the above expression. This gave a calculated value of f which could be compared with the frequency at which the phase-angle ellipse was converted to a straight line.
A capacitor placed across the tube may be advantageous in removing the inductive effects at 50-100 Hz and reducing ripple voltages in the output. A large capacitor (greater than 1 *mu;F) often causes relaxation oscillations which may be due to the inductance of the tube, together with possible negative-resistance portions in the characteristic. However, a value of 0.1 μF has been found a satisfactory value to use9. This should suppress any tendency for the tube to oscillate.
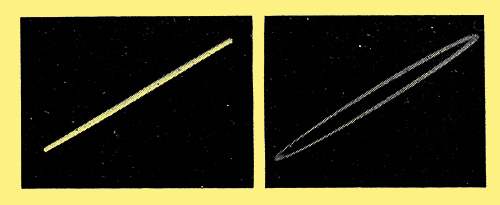
Fig. 14. 85A2, 20 Hz, 5mA, DC Fig. 15. 85A2, 200 Hz, 5mA, DC.
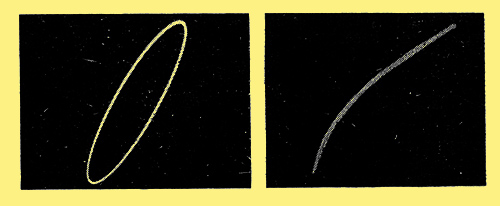
Fig. 16. 85A2, 2 kHz, 5mA, DC Fig. 17. 7475, 20 Hz, 5mA, DC (Large current swing).
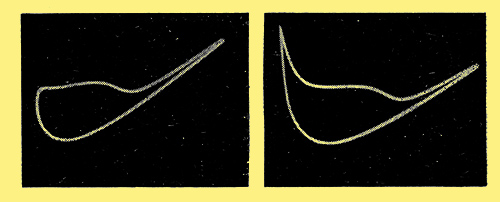
Fig. 18. 85A1, 20 Hz 3.5 mA, DC Fig. 19. 85A1, 20 Hz 3mA, DC.
Figs. 14, 15 and 16 show the ellipses obtained with an 85A2 tube at 20, 200 and 2,000 Hz respectively. These are also typical of the other types of tube investigated. The increase in reactance with frequency can be readily interpreted.
Fig. 17 shows a 7475 tube at 20 Hz with a rather large applied AC voltage, ie a large current swing about the mean DC (2 - 8 mA approx.) This trace represents dynamically the characteristic of the tube over its operating range. There is a variation of impedance over the current range shown by the changing slope of the curve. The high-stability types give traces which are very much straighter over a similar range, except in the region of 2 mA where a loop is visible due to hysteresis effects. Figs. 18 and 19 show this effect with the 85A1 tube over a current range 2 - 5 mA approx., Fig. 19 being over a slightly larger range. A further increase would cause the tube to become extinguished in the region of 1 mA.
The S130 tubes showed ellipses similar to the other types, but in many cases pronounced oscillation and instability took place. In troublesome cases the tubes were rejected as it would be impossible to interpret fully the results obtained. Changes in the shape of the ellipses were accompanied by changes in the area of cathode glow.
Other investigators8,9 have obtained similar results to the above at the lower frequencies, but no mention of inductive effects and no measurements beyond 120 Hz have been made. Kiryluks suggests a circuit for selection of optimum operating conditions for reference tubes. His experiments were made at 50 Hz where the effects of inductance begin, and although hysteresis may be present in the static characteristic the effects attributed to this effect may be partly due to inductance at 50 Hz. A better frequency for observation of the dynamic characteristic is 15 - 20 Hz where the reactance is greatly reduced due to lower inductance and the lower frequency. The method does give a good indication of the static characteristic and enables the best operating range to be selected for a given tube very quickly.
Acknowledgments
The work recorded in this article has been carried out in the Department of Electrical Engineering at the University of Sheffield. The authors wish to thank Mr O I Butler, MSc, MIEE, AMIMechE, for facilities afforded in the laboratories of this department. They also wish to acknowledge the kindness of Mullard Ltd, in supplying some of the tubes for examination.
References
- Andrew, A.M The Design of Series-Parallel Voltage Stabilizers. Electronic Engng. 24, 385 (1952).
- Benson, F A Voltage Stabilizers. (Electronic Engineering Monograph, 1950).
- Hunt, J E P Some Limitations in Voltage Stabilizers. Instn. Elect. Engrs. Stud. Quart. J. 23, 12 (1952).
- Benson, F A The Design of Series-Parallel Voltage Stabilizers. Electronic Engng. 24, 118 (1952).
- Benson, F A, Carter, A O Phase-Angle Measurements Using a Cathode-Ray Tube. Electronic Engng. 22, 238 (1950).
- Benson, F A, Seaman, M S A Note on Phase-Angle Measurements Using a Cathode-Ray Tube. Electronic Engng. 25, 100 (1953).
- Benson, F A A Study of the Characteristics of Glow-Discharge Voltage-Regulator Tubes. Electronic Engng. 24, 396 and 456 (1952).
- Kirgluk, W Voltage-Regulator Tubes (Letter). Electronic Engng. 25, 83- (195 ).
- Elmore, W C, Sands, M Electronics, p. 369 (McGraw Hill, 1949)
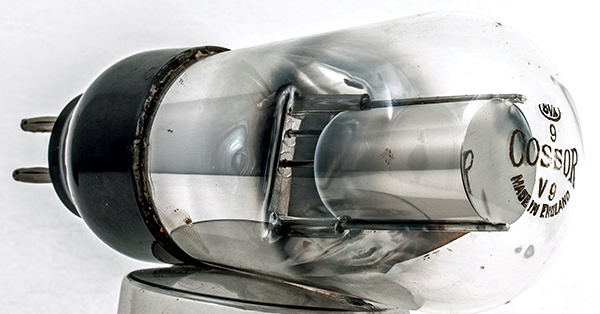
The Cossor S130
|